Monthly Archives: September 2023

Energy Market Dynamics: Keys to Navigating Volatility, By Annie Boasberg, The Megawatt Hour

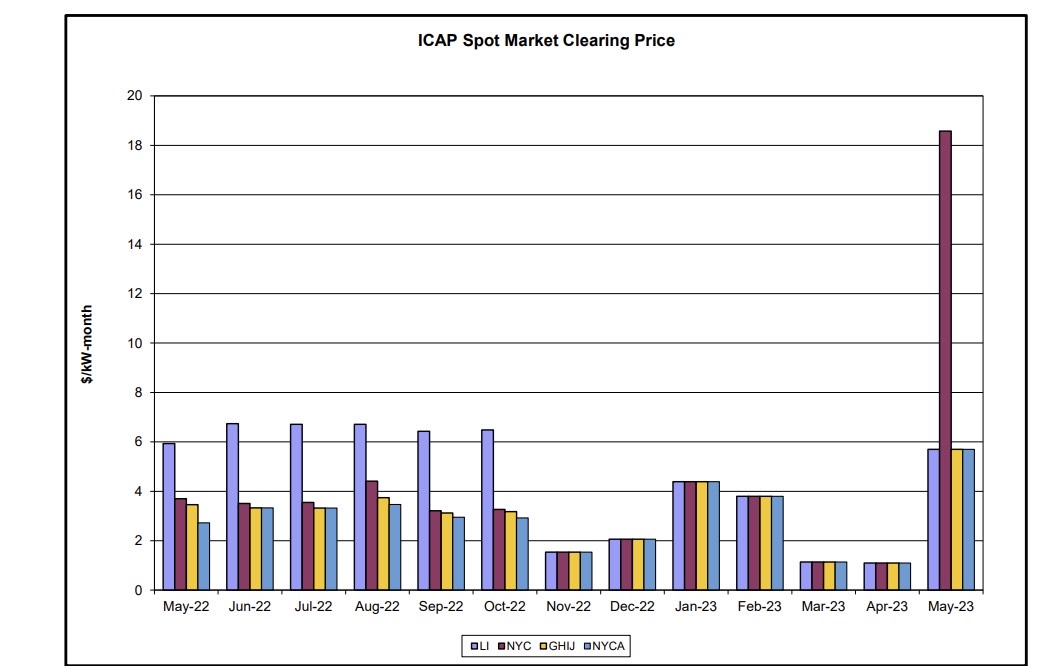
Why are we seeing volatility?

As we noted in our article “What to know about energy markets”, energy markets are the most volatile we’ve seen in over a decade. Both energy and capacity markets have grown more dynamic and volatile as you can tell from May-23 in the figure ICAP Spot Market Clearing Price. While we can point to some factors driving this volatility, it is nearly impossible to predict how the market will look in the future. What is clear, however, is that as we phase out natural gas and fossil fuels, it is even more important to pay attention to energy markets and to pay attention to the dynamics of the energy transition. 

Take Advantage of Energy Market Conditions

            It is important to remember that energy markets are financial markets. The most significant determinant of your costs as a buyer is when you buy– it is more important than what product or what approach you take to buying. You can manage your energy costs and look at markets to inform decisions. 

In addition to paying attention to markets, the following strategies can help you as you navigate these volatile market trends. 

6 Keys to Navigating Volatility 

  1. Understand market dynamics: Understanding where we are, what the history of the market is, and what the forward curve looks like is important to informing decision making. When you are operating in markets that are this volatile, it is also important to be realistic about the impact of financial markets on future costs… most customers try to plan their budgets using prior realized costs. We don’t recommend doing that. Get a forecast using current forward markets.
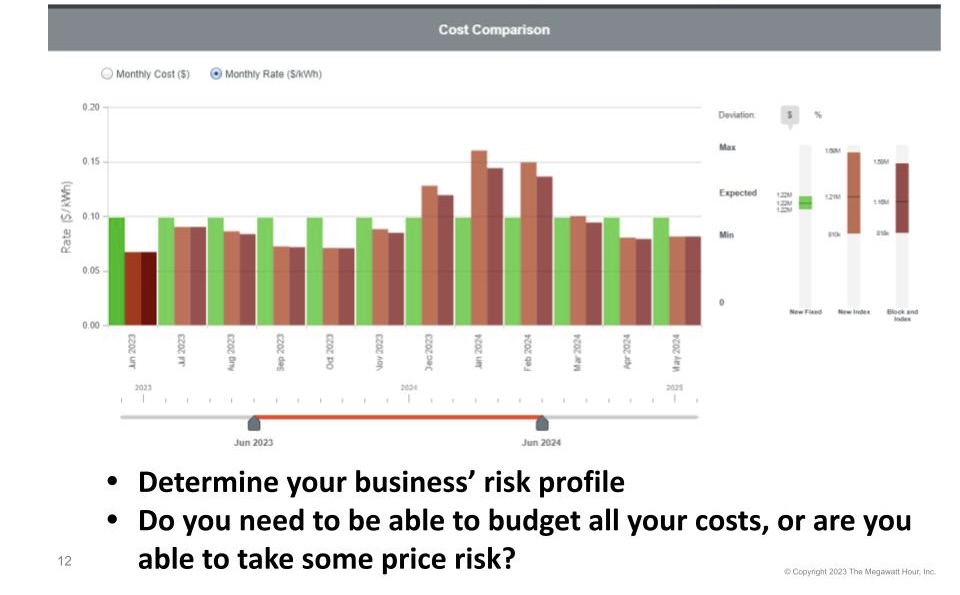
  1. Determine your risk appetite: Determine your business’ risk profile. Taking risks can be beneficial depending on your company’s risk appetite. Having the flexibility to take risks in the power and gas markets may result in lower costs over time. You have options when you engage in energy markets. You do not have to just purchase a fixed price or an index rate.

    The following graph compares the monthly unit rate for 3 different energy products: a fixed price, in green, an index, in dark red or a hybrid of these two options: The index with a block of power. You need to determine what matters most to you as an organization. Then you need to be actively engaged in purchasing to make sure your purchasing strategy matches your institution’s goals: Do you prioritize budget certainty over cost? Are you willing to take some risk and let some parts of your cost float on an index? This is one of the most important conversations you can have as an organization. We would recommend that you revisit the strategy conversation regularly as markets evolve. 
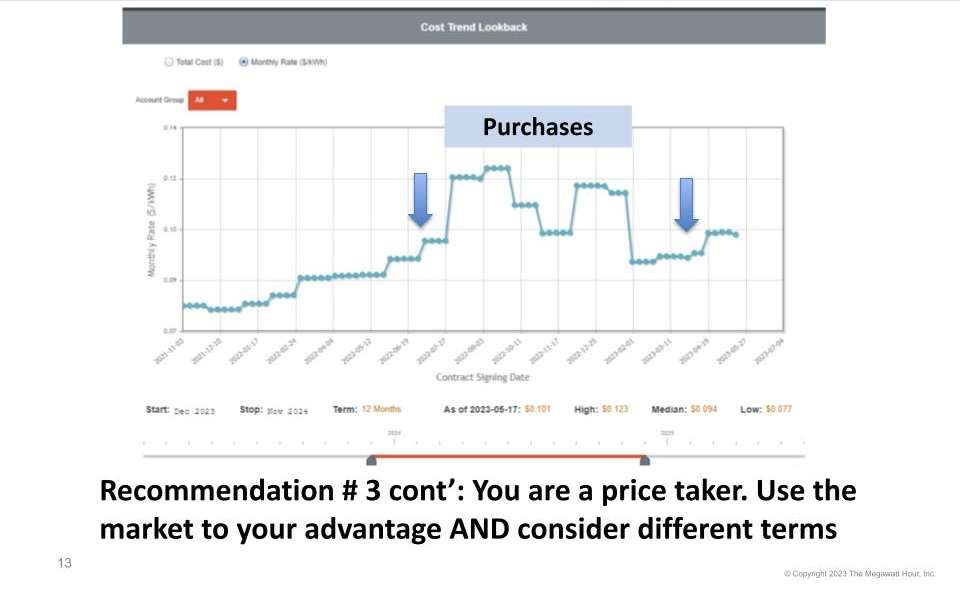
  1. Take advantage of volatility: Assuming your business is operating well and is stable, you will always be in a position to make energy purchases well into the future. You don’t need to be passive and accept pricing delivered just months or weeks before your contract expires. Purchasing energy in advance before your current contract ends will allow you to take advantage of volatility rather than being subject to it. How do you know whether to buy? Well, if you’ve determined your risk appetite and budget targets, then you will want to look for products and pricing that meet those goals.  
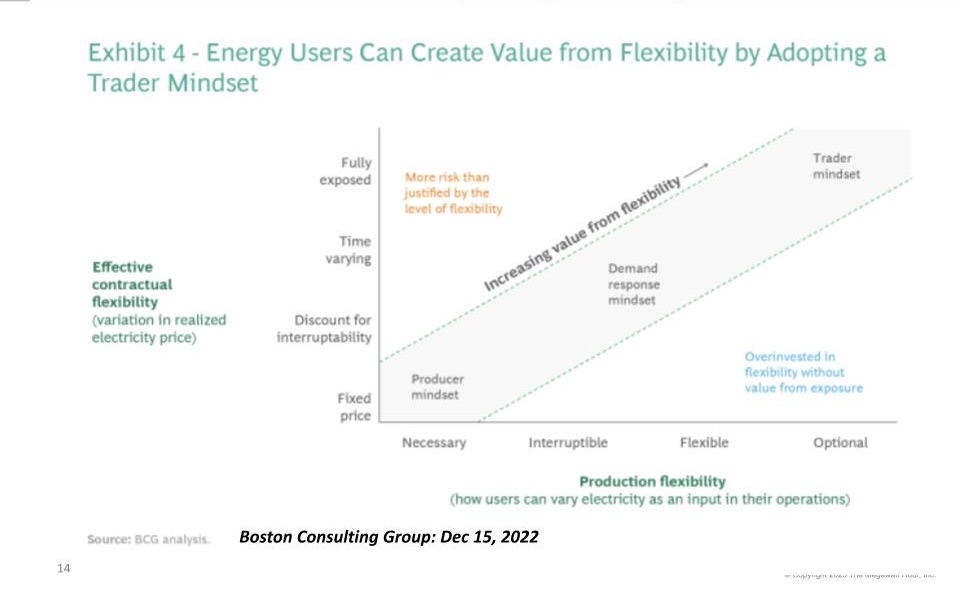
  1. Be flexible: The following graphic is drawn from a Boston Consulting Group article titled “What CEO’s Can Learn from Energy Traders”, largely in response to volatility in energy markets. The article recommends, to the extent possible, introducing as much market-responsive flexibility as possible into an organization. Think of your operation as being integrated with markets and make sure, to the extent possible, you are able to respond to market changes and volatility. That is typically easier to do for a manufacturing facility, for example. But there are ways to build greater flexibility into your operation no matter what your business. Adopt a trader mindset as we transition to a different grid. Customers benefit from becoming more flexible in responding to price signals and shifting operations rather than being entirely price takers. 
  1. Participate in demand response programs: Demand response programs strategically help customers reduce their costs by either reducing energy (kWh), demand (kW), which is part of the utility delivery bill, selling load reduction Capacity into wholesale Capacity markets, and/or by reducing your capacity tag.
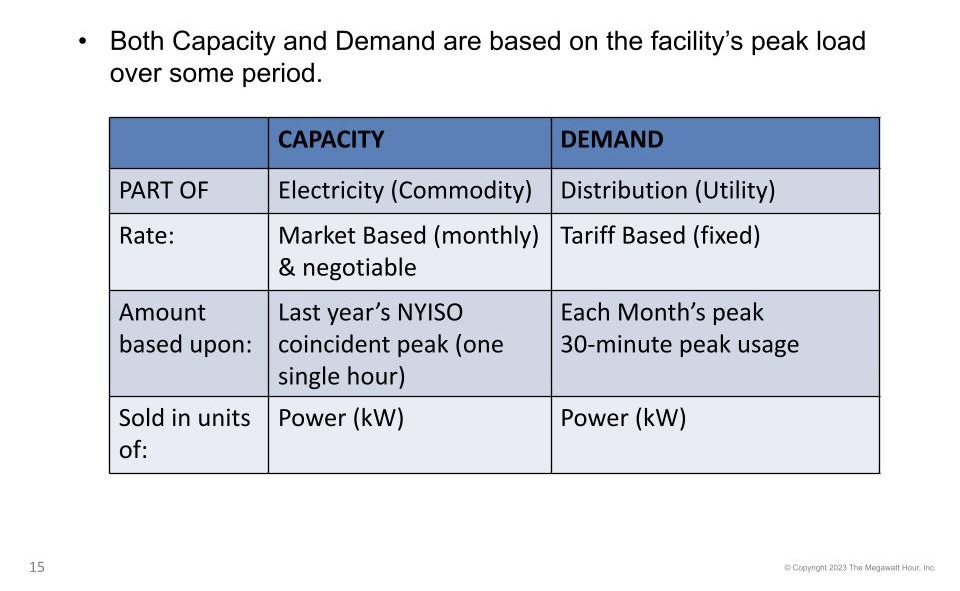
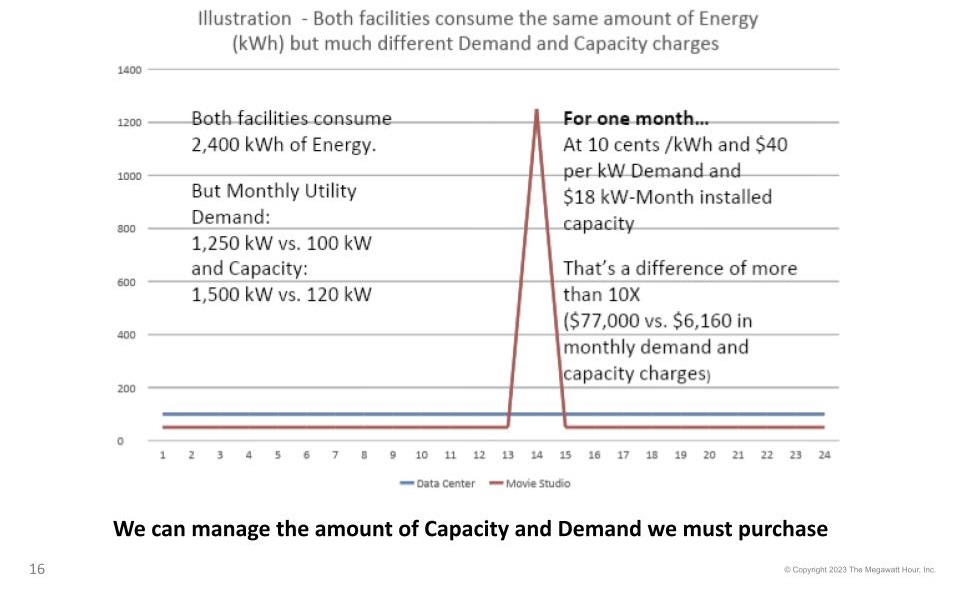
  1. Reducing load during peak periods can decrease demand charges and overall energy consumption. Large energy users who participate in these programs can also receive payments for reducing their electricity usage during peak hours. Managing demand and capacity during peak periods can be an important and lucrative undertaking, as you can see from the following graphic. Two customers (in this case a movie studio, in red, and a data center, in blue) can have the same kWh usage with dramatically different kW peak demand. Both facilities consume 2,400 kWh of energy on a single day. Monthly utility demand reaches 1,250 kW for the movie studio when they’re producing a film vs. 100 kW for the data center.  Capacity is a similar story: 1,500 kW vs. 120 kW. For one month at 10 cents /kWh and $40 per kW Demand and  $18 kW-Month Installed Capacity (ICAP), that’s a difference of  more than 10X ($77,000 vs. $6,160 in monthly demand and capacity charges).
  1. So, how do customers effectively make the most of operational flexibility? There are a number of programs in NY state and across the country that can help customers lower their demand and capacity and achieve the benefits of these programs.
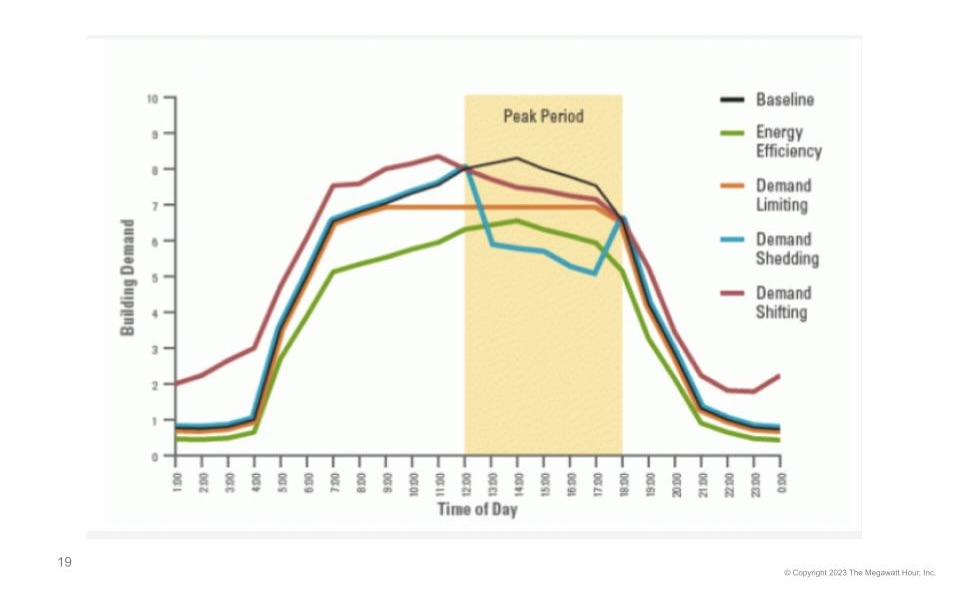
    1. Emergency programs are designed to maintain grid reliability during unexpected contingencies or extreme grid conditions.
    1. Peak Shaving Programs alert people to reduce their energy usage at peak hours to reduce cost.
    1. Demand Shedding is the most common strategy of reducing loads for demand response. Examples of how to shed load include turning equipment off, stopping production lines, or shifting energy usage from electricity to steam and countless other methods. The ability to shed demand at certain times can be very strategic  and can result in cost reductions for a single month or, in the case of ICAP Tag reduction, the entire year.

Customers are paid to reduce their electric load during key time periods. The value of participation is extraordinary – 1 Megawatt of load reduction is worth over $250,000. in NYC in 2023. Payments are made to customers whether the program is activated or not – like a reservation payment. We may not be able to do much about the price of capacity or demand but we can affect how much we have to buy.

Contact an Aggregator like Innoventive Power, who will:

  • Evaluate the facility for DR strategies and quantify the potential value
  • Enroll the facility and operate the program
  • Customer responsibility is to execute the load reduction plan when called
  1. Finally, communicate openly and often with your colleagues: Over communicate dynamics in the marketplace so you can feel confident in providing advice to colleagues. Transparency through communication is key to inform decision making especially as we confront dynamic market conditions. 

Final Advice

  • Notice changes in the industry. Customers cannot afford to ignore market dynamics. Pay attention to what is driving energy costs today and into the future. This will allow you to make reasonable and responsible decisions.
  • Use markets to your advantage. Be flexible! 
  • Understand and participate in demand response programs.
  • Use evidence and knowledge to make decisions, use these tools to navigate the transition. 
  • Set goals, identify a strategy, manage budgets, and communicate.

Energy Market Dynamics: Understanding Your Energy Cost, by Annie Boasberg, The Megawatt Hour

The energy grid and energy markets are in transition and will continue to be over the next several decades. This transition is causing disruption and volatility in energy markets. This past July, The Megawatt Hour and Innoventive Power co-hosted a webinar titled “Energy Market Dynamics: How Best to Manage Risk and Costs “ (you can listen to the Webinar here) to explore this topic in detail. The Webinar’s goal was to familiarize commercial and industrial customers with energy markets, this transition and what you need to know to manage energy costs effectively in this environment. Innoventive Power and The Megawatt Hour were able to focus on both supply and demand side strategies during the hour-long session. This article and the one that follows, “Energy Market Dynamics: Keys to Navigating Volatility”, summarize the main points presented during the Webinar. 

PwC 2023 US Large Energy User Survey: conducted Sept-Oct 2022

Energy Costs and Market Conditions

Over the past 12-18 months, most power purchasers will have noticed that prices were higher and more volatile than they have been in over a decade. Why? There are a number of factors, including a supply-demand imbalance largely brought about by the global pandemic. Another key factor contributing to dynamic markets is that the grid is in transition from a more fossil-fuel based, centrally managed power grid, to a greater reliance on renewable energy and distributed resources. Why do you care about market volatility and a grid in transition? Well, two reasons, really: cost + reliability. Let’s start with cost. 

As consumers of energy, all customers participate in financial markets. Energy users, you pay your supplier for the cost of Energy, Ancillary Services, and Capacity. With this information, customers can understand the different components of costs to track and improve their budgets. No matter what you do, you are engaging in energy markets– whether you’re buying from your local utility or a third party supplier. Energy markets are financial markets. That can often lead customers to feel somewhat helpless, at the mercy of markets. Understanding the components of cost will help you to control and, we hope, ultimately manage these costs effectively. If you were to go out to a supplier (an ESCO or REP) and ask for an electricity price right now, the following are the components of supply cost that the supplier would consider in order to provide you a price (see graphic, below).

Energy: The first and largest component of cost is the energy cost. This cost, to be a bit technical, is the ISO load zone cost that includes everything needed to generate the power and move it through the ISO high-voltage transmission system to the area where your load is situated. Customers pay suppliers for Energy in units of kilowatt hours or kWh ($/kWh). 

 Ancillary Services: Secondly, a customer is charged per kWh for ancillary services. These charges cover the cost of using generator facilities to ensure a stable and responsive system in addition to covering the cost of ISO operations. These costs are becoming more relevant to customers as the grid transitions.

Capacity: Next, a customer pays a capacity charge per kW per month. The capacity charge is a payment to generators to simply be available for power generation when system loads peak.  NY has a capacity market– neither Texas nor California have a capacity market. Capacity payments ensure generators can operate during the peak hour on the peak day of the year. A customer’s capacity or “ICAP tag” represents a customer’s load on this peak hour multiplied by a reserve margin and determines how much Capacity (in units of kilowatts or kW) the account much purchase for the entire year 

Supply Margin and Fees: Lastly, customers pay suppliers a profit margin and risk premium. If you hire a broker or consultant for advising, suppliers will often add these to the supply cost as an extra cost.

The graphic, below, shows that there has been significant movement over the course of the year in energy markets. This graphic demonstrates the volatility we have experienced in NY markets over the past year. It will look much the same for any market. To orient you, a forward strip of power is what you would buy from a supplier for the largest portion of your supply bill, Energy (that orange part of the bar that we just looked at). This graph shows how the same forward strip of power has moved over the last year. 

On the far left side of the graph you can see what you would have paid if you bought power for June 2023-June 2024 a year ago (which you can do, by the way). A year ago, you would have paid $85/MWh for on-peak power. If you bought in Sept ‘22, you would have paid over $110/MWh, if you bought more recently, you would have paid $65-$67/MWh. That’s a swing of 40% in a few short months. 

Most of this variability is driven by changes in gas markets. As you will notice, from the graphic below, natural gas is the underlying fuel for electricity generation which typically sets the marginal price for power in NY State and in many markets.  When gas prices are high or volatile, so are power prices. One thing to keep in mind, however, is that we are transitioning away from fossil fuel driven power generation… so we don’t know what will set the marginal cost of power in the future. That uncertainty will likely contribute to continued volatility in markets in the next decade or so… Throughout the grid transition, we expect continued volatility and the potential for significant changes in energy costs, which is why it is important to pay attention to market dynamics.

Source: NYISO Power Trends 2023

So, now that we’ve provided you with some indication of what to expect from energy markets, what can you do about it? Is there any way to manage through these challenges and volatility? The second half of the July Webinar focused on how customers can respond to dynamic markets. We summarize our recommendations in the following article titled “Energy Market Dynamics: Keys to Navigating Volatility”.

For more information on budgeting, reference our article on 2020 Energy Insights: Budgeting and forecasting recommendations”.

Anna Boesberg works for The Megawatt Hour: www.themwh.com

Underground Heat: A Problem And A Solution?

New research shows that underground heat given off by buildings is growing and is a potential risk to the environment and general infrastructure. Rising underground temperatures may be compromising the safety of civil structures.

Most underground structures, such as basements, parking garages, subways, and tunnels, release heat that warms the rocks and soil they were built in. Over time, geological layers expand and contract, and potentially damage the supporting rocks and soil and risk shifts. Excess heat can deform rocks and soil, and, potentially, the construction materials embedded within it.

One major study in Chicago’s Loop involved the usage of 150 temperature sensors throughout the surface and subsurface environment in the Chicago Loop to determine trends and correlations between outdoor and subsurface temperatures throughout the seasons in building basements, parking garages, and tunnels.

Analysis of the temperature readings showed strong correlations between the temperature at the surface of the Loop and those in certain underground structures, based on how deep the structure is and the use of the area. Building basements tended to be hotter because of boilers and other processes used there. Older buildings generated more heat, presumably, because they are less energy efficient to use waste heat. However, whether heat is generated in the space or not, higher-than-expected temperatures were measured. In addition, these higher temperatures could, in time, cause millimeter-level soil deformations. The researchers believed this would not compromise structural integrity but may worsen operational efficiency.

It should be noted that these results may differ in other areas based on the density of big buildings, their uses, the soil structure (Chicago has high-clay soil which conducts heat more than rock), and the location of Lake Michigan and the Chicago River not far away (acting as a heat sink).

Therefore, if excess heat is produced and found in underground structures and tunnels, might it be part of the solution for Climate Change and energy efficiency? Might ground source heat pumps be able to use some of the underground excess heat and displace some electricity and fossil-fuel-powered heat/steam generation for comfort? Thus, excess heat may represent an opportunity. Heat maps could potentially be developed to identify the best locations to remove excess heat (reducing collateral damage) and use it for heating buildings or hot water production.

CCES has the experts to help you determine whether air- or ground source heat pumps might be a solution for you to reduce your energy usage and costs and reduce your greenhouse gas emissions, too. Contact us today at karell@CCESworld.com or at 914-584-6720.

Updated Federal Tax Deduction Rule For Building Upgrades

The passage of the Inflation Reduction Act (IRA) in 2022 saw the Federal Government commit billions of dollars in new spending and tax incentives to building energy efficiency and electrification programs. What has been overlooked by some is that the IRA expanded Sec. 179D of the IRS code, the tax deduction for energy efficient commercial buildings. A “commercial” building is defined as a non-residential building and residential buildings greater than 3 stories.

The IRA changed the 179D program so that existing buildings which reduce energy use intensity (EUI) by 25% to 50% from a pre-retrofit baseline are now eligible for the tax deduction. 179D had been tailored more to new buildings which can use energy models to demonstrate energy savings. Thus, existing building owners making upgrades not only save on energy costs but can now use 179D to reduce their tax liability on the property. While the new construction pathway remains, this expands eligibility.

In addition, there is more money available for tax deductions. Before the IRA, the 179D deduction was $1.80 / sq. ft.; now it ranges from $2.50 to $5.00 / sq. ft.

The IRS is expected to issue guidance later in 2023 about how building owners can take advantage of the retrofit pathway, we know that existing buildings would be eligible for the 179D tax deduction by meeting the following requirements:

  1. Cannot have previously claimed 179D deduction as a new building.
  2. Establish a baseline site Energy Use Intensity (EUI). The simplest way is by benchmarking energy usage in ENERGY STAR Portfolio Manager, which calculates the building’s EUI.
  3. Develop a “Qualified Retrofit Plan”. A written plan must be developed by a “Qualified Professional” (licensed architect or professional engineer) that:
    • Certifies current site EUI;
    • Describes the recommended upgrades to interior lighting, heating, cooling, ventilation, hot water, or envelope systems;
    • Certifies that the recommended building upgrades were installed, and;
    • Demonstrates that the building’s improved site EUI was achieved due to the building improvements.
  4. Reduce Site EUI by at least 25%. Buildings are eligible for a $2.50 / sq. ft. deduction for cutting site EUI by 25% rising to $5.00 / sq. ft. if they reduce the EUI by 50% or more.

The updated 179D requires projects to meet wage and apprenticeship standards on the project—including for contractors and subcontractors. Projects that do not satisfy these labor standards are still eligible for tax deductions, but at a significantly lower rate.

CCES has the experts to help you understand 179D and perform the steps above to take advantage of the revised rule and provide a significant tax benefit for upgrades to your building, besides saving significant energy costs. Contact us today at 914-584-6720 or at karell@CCESworld.com.