The energy grid and energy markets are in transition and will continue to be over the next several decades. This transition is causing disruption and volatility in energy markets. This past July, The Megawatt Hour and Innoventive Power co-hosted a webinar titled “Energy Market Dynamics: How Best to Manage Risk and Costs “ (you can listen to the Webinar here) to explore this topic in detail. The Webinar’s goal was to familiarize commercial and industrial customers with energy markets, this transition and what you need to know to manage energy costs effectively in this environment. Innoventive Power and The Megawatt Hour were able to focus on both supply and demand side strategies during the hour-long session. This article and the one that follows, “Energy Market Dynamics: Keys to Navigating Volatility”, summarize the main points presented during the Webinar.
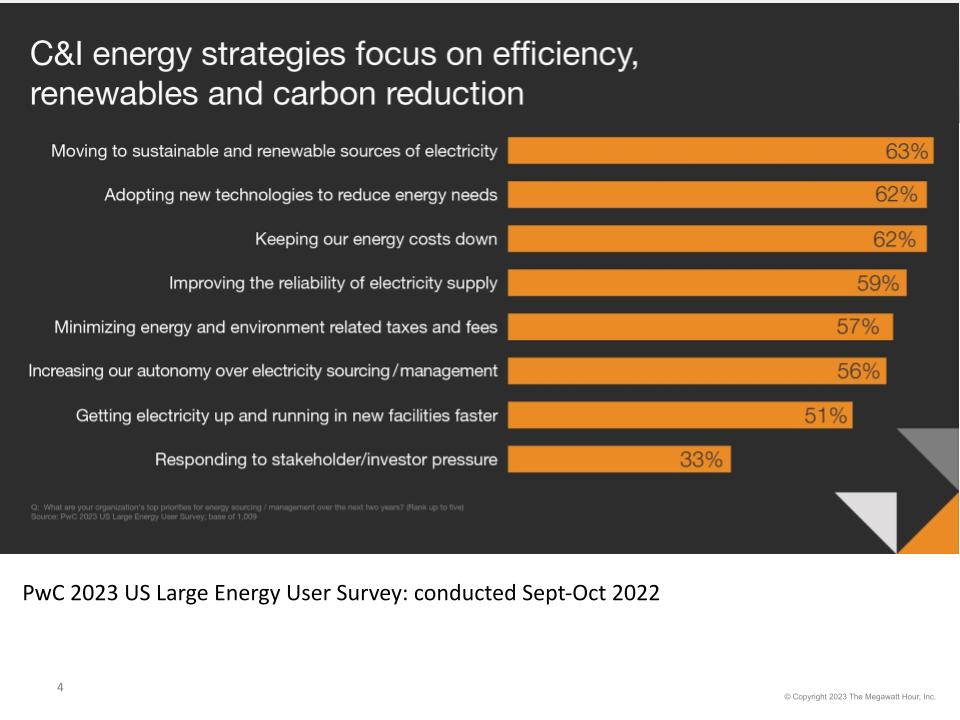
PwC 2023 US Large Energy User Survey: conducted Sept-Oct 2022
Energy Costs and Market Conditions
Over the past 12-18 months, most power purchasers will have noticed that prices were higher and more volatile than they have been in over a decade. Why? There are a number of factors, including a supply-demand imbalance largely brought about by the global pandemic. Another key factor contributing to dynamic markets is that the grid is in transition from a more fossil-fuel based, centrally managed power grid, to a greater reliance on renewable energy and distributed resources. Why do you care about market volatility and a grid in transition? Well, two reasons, really: cost + reliability. Let’s start with cost.
As consumers of energy, all customers participate in financial markets. Energy users, you pay your supplier for the cost of Energy, Ancillary Services, and Capacity. With this information, customers can understand the different components of costs to track and improve their budgets. No matter what you do, you are engaging in energy markets– whether you’re buying from your local utility or a third party supplier. Energy markets are financial markets. That can often lead customers to feel somewhat helpless, at the mercy of markets. Understanding the components of cost will help you to control and, we hope, ultimately manage these costs effectively. If you were to go out to a supplier (an ESCO or REP) and ask for an electricity price right now, the following are the components of supply cost that the supplier would consider in order to provide you a price (see graphic, below).
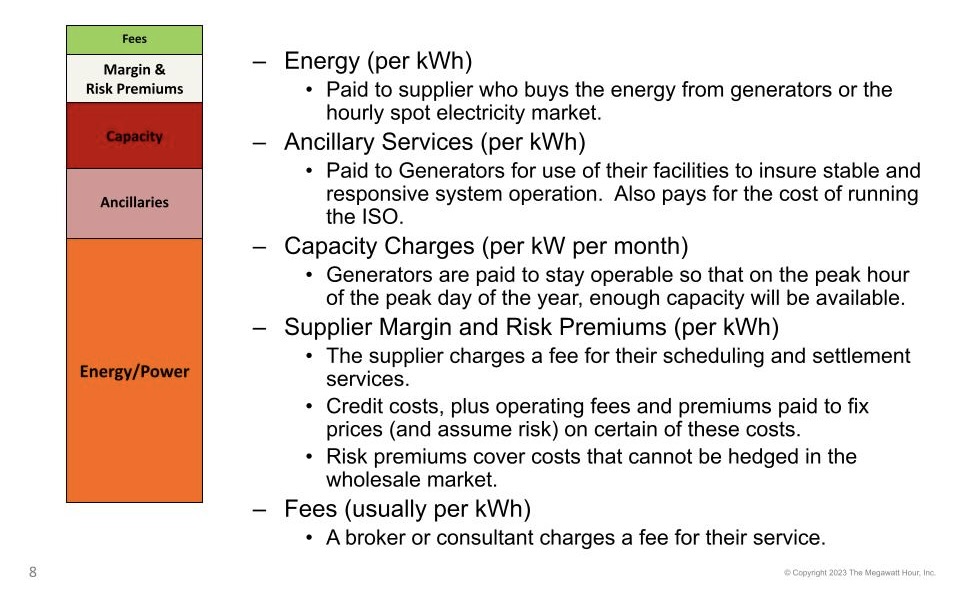
Energy: The first and largest component of cost is the energy cost. This cost, to be a bit technical, is the ISO load zone cost that includes everything needed to generate the power and move it through the ISO high-voltage transmission system to the area where your load is situated. Customers pay suppliers for Energy in units of kilowatt hours or kWh ($/kWh).
Ancillary Services: Secondly, a customer is charged per kWh for ancillary services. These charges cover the cost of using generator facilities to ensure a stable and responsive system in addition to covering the cost of ISO operations. These costs are becoming more relevant to customers as the grid transitions.
Capacity: Next, a customer pays a capacity charge per kW per month. The capacity charge is a payment to generators to simply be available for power generation when system loads peak. NY has a capacity market– neither Texas nor California have a capacity market. Capacity payments ensure generators can operate during the peak hour on the peak day of the year. A customer’s capacity or “ICAP tag” represents a customer’s load on this peak hour multiplied by a reserve margin and determines how much Capacity (in units of kilowatts or kW) the account much purchase for the entire year
Supply Margin and Fees: Lastly, customers pay suppliers a profit margin and risk premium. If you hire a broker or consultant for advising, suppliers will often add these to the supply cost as an extra cost.
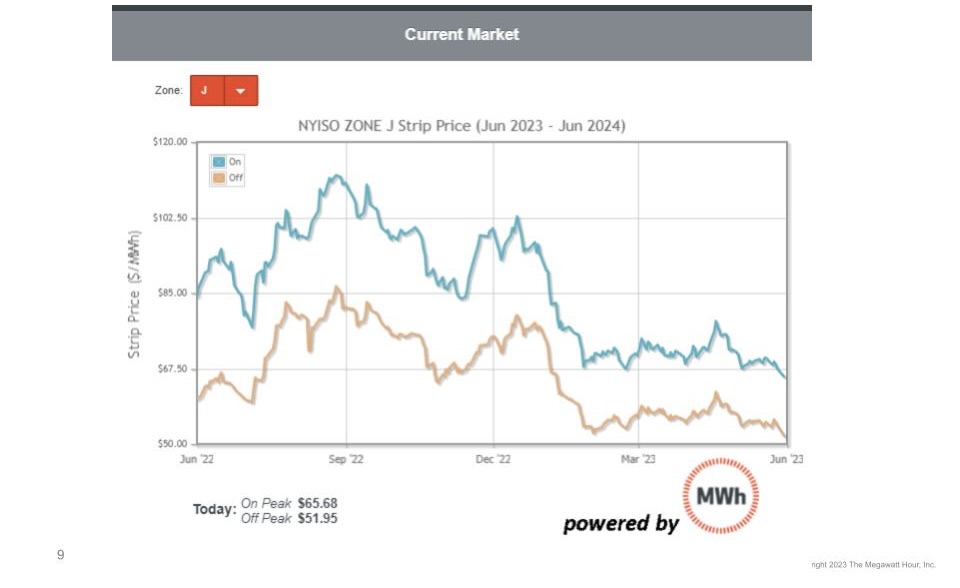
The graphic, below, shows that there has been significant movement over the course of the year in energy markets. This graphic demonstrates the volatility we have experienced in NY markets over the past year. It will look much the same for any market. To orient you, a forward strip of power is what you would buy from a supplier for the largest portion of your supply bill, Energy (that orange part of the bar that we just looked at). This graph shows how the same forward strip of power has moved over the last year.
On the far left side of the graph you can see what you would have paid if you bought power for June 2023-June 2024 a year ago (which you can do, by the way). A year ago, you would have paid $85/MWh for on-peak power. If you bought in Sept ‘22, you would have paid over $110/MWh, if you bought more recently, you would have paid $65-$67/MWh. That’s a swing of 40% in a few short months.
Most of this variability is driven by changes in gas markets. As you will notice, from the graphic below, natural gas is the underlying fuel for electricity generation which typically sets the marginal price for power in NY State and in many markets. When gas prices are high or volatile, so are power prices. One thing to keep in mind, however, is that we are transitioning away from fossil fuel driven power generation… so we don’t know what will set the marginal cost of power in the future. That uncertainty will likely contribute to continued volatility in markets in the next decade or so… Throughout the grid transition, we expect continued volatility and the potential for significant changes in energy costs, which is why it is important to pay attention to market dynamics.
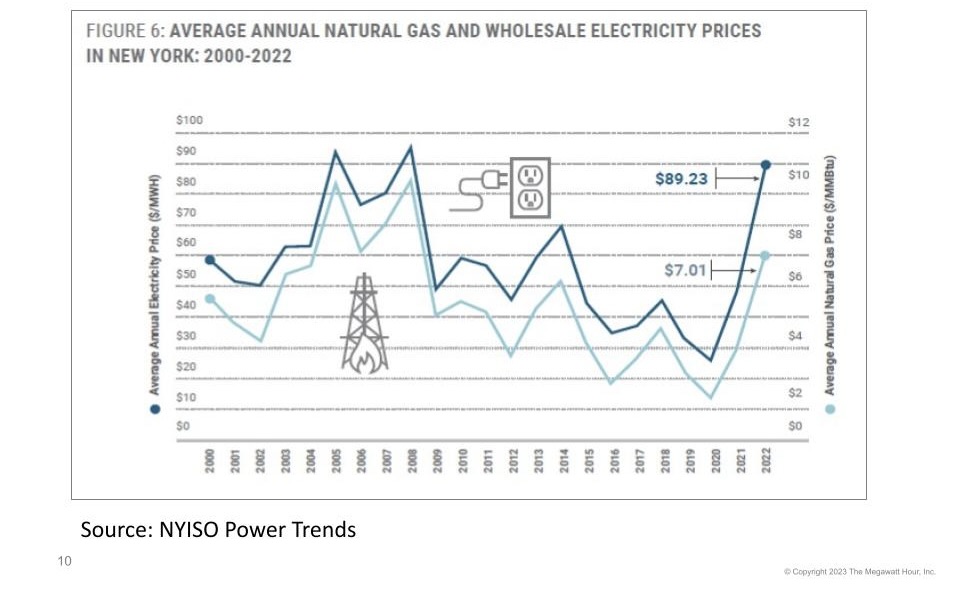
Source: NYISO Power Trends 2023
So, now that we’ve provided you with some indication of what to expect from energy markets, what can you do about it? Is there any way to manage through these challenges and volatility? The second half of the July Webinar focused on how customers can respond to dynamic markets. We summarize our recommendations in the following article titled “Energy Market Dynamics: Keys to Navigating Volatility”.
For more information on budgeting, reference our article on 2020 Energy Insights: Budgeting and forecasting recommendations”.
Anna Boesberg works for The Megawatt Hour: www.themwh.com